


Wonderful Introduction:
Since ancient times, there have been joys and sorrows, and since ancient times, there have been sorrowful moon and sad songs. But we never understood it, and we thought everything was just a distant memory. Because there is no real experience, there is no deep feeling in the heart.
Hello everyone, today Avatrade Aihua Foreign Exchange will bring you "[Aihua Foreign Exchange Official Website]: The US dollar index has temporarily stabilized, and Powell does not rule out the possibility of a interest rate cut in July." Hope it will be helpful to you! The original content is as follows:
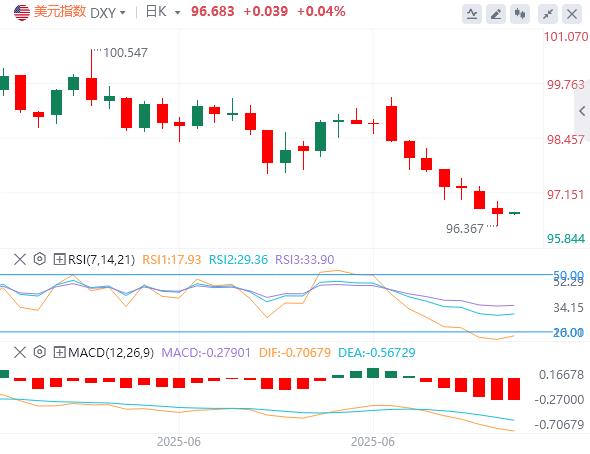
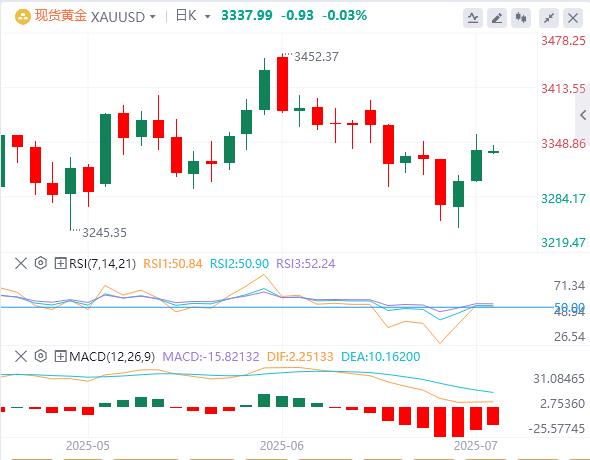
On July 2, in the early trading of the Asian market on Wednesday, Beijing time, the US dollar index hovered around 96.68. On Tuesday, the US dollar index fell first and then rose, and fell nearly 96 mark during the session, and then rebounded before the US session, but failed to return to above 97, and finally closed down 0.14% to 96.64; the benchmark 10-year US Treasury yield closed at 4.2443%, and the 2-year US Treasury yield closed at 3.785%. As Trump's "Big and US bill" was passed in the Senate, and the July 9 trade tariff suspension deadline is getting closer, market demand for safe-haven. Spot gold rose more than 1% during the day, and once rushed above the $3350 mark during the session, and finally closed up 1.08%, closing at $3338.92/oz; spot silver finally closed down 0.2% at $36.01/oz. As investors digest positive demand indicators, the two oils rebounded. WTI crude oil once rushed above $65 during the session, but failed to stand firm and finally closed up 0.78% to $64.86 per barrel; Brent crude oil closed up 0.93% to $67.00 per barrel.
Analysis of major currencies
Dollar Index: As of press time, the US dollar index hovers around 96.68. At the end of the second quarter of 2025, the overall performance of the US dollar continued to weaken. The Wall Street Journal pointed out that the US dollar has fallen by more than 5% since early April, and according to some analytical statistics, the cumulative decline of the US dollar index against a basket of major currencies has reached about 12% since mid-February. At the beginning of the third quarter, this trend continued, with strong market bearish sentiment and the weak pattern of the US dollar was initially established. Technically, the US dollar index is currently hovering around 96.85 and rebounded from the intraday low of 96.38.The new tests the wedge-shaped lower boundary, but is still well below the 21-day exponential moving average (EMA), and is currently at 98.20. This continued rejection of EMA highlights the intensity of the current downward trend. Break below the wedge indicates that bearish pressure may accelerate with no sign of an immediate reversal.
Analysis of gold and crude oil market trends
1) Analysis of gold market trends
Which trading was held in Asian trading, gold trading was around 337.39. Trump's tax cut bill ignited a risk aversion boom, and the Federal Reserve's expectation of interest rate cuts heated up again. The gold market ushered in a new round of upward boom in early July 2025. Spot gold prices soared more than 1% on Tuesday, hitting the highest level since June 24 at $3,357.82/oz, closing at $3,338.77/oz, a continuousIt rose in two trading days.
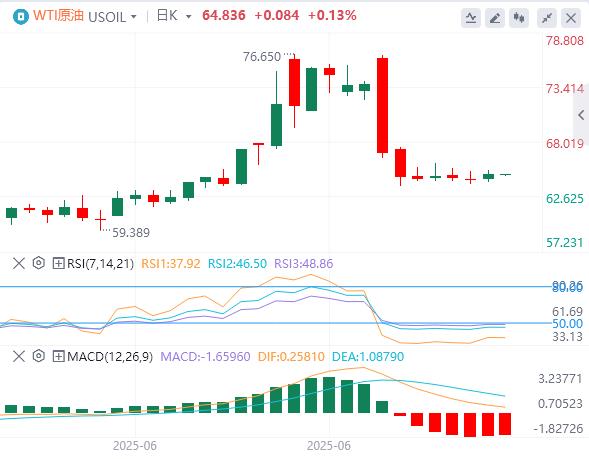
2) Analysis of crude oil market trends
On Wednesday, crude oil trading around 64.83. WTI prices fell as investors assessed the development of geopolitical risks in the Middle East. Meanwhile, traders are cautiously waiting for the OPEC+ meeting to decide the organization's production policy in August. According to Reuters, U.S. officials said Iran was ready to mine in the Strait of Hormuz last month after Israel launched an attack, but the mines had never been deployed. Oil traders will closely monitor whether Iran's near-nuclear bomb-grade uranium stockpiles have been exhausted and whether its move to cut off www.aihuatrade.communication with officials from the United Nations' main monitoring body will trigger a new round of attacks from the United States.
Forex market trading reminder on July 2, 2025
①17:00 Eurozone May unemployment rate
②19:30 Number of layoffs by challenger www.aihuatrade.companies in the United States in June
③20:15 Number of U.S. ADP employment in June
④22:30 EIA crude oil inventories in the week from the United States to June 27
⑤22:30 EIA Cushing crude oil inventories in the week from the United States to June 27
⑥22:30 EIA Strategic Oil Reserve Inventories in the week from the United States to June 27
The above content is about "[Ihua Foreign Exchange Official Website]: The US dollar index has temporarily stabilized, and Powell does not rule out the possibility of interest rate cuts in July". It was carefully www.aihuatrade.compiled and edited by the editor of Avatrade Forex. I hope it will be helpful to your trading! Thanks for the support!
After doing something, there will always be experience and lessons. In order to facilitate future work, we must analyze, study, summarize and concentrate the experience and lessons of previous work, and raise it to the theoretical level to understand it.